I led the redesign to modernize Flodata into a scalable iPaaS platform — simplifying onboarding, streamlining user flows, and introducing real-time monitoring and governance. Below are selected contributions.
Summary
Flodata was serving 12 enterprise clients and generating $8M in ARR, but the platform faced a critical problem: integrations were slow, brittle, and heavily dependent on technical teams. Customers struggled with weeks-long onboarding, error-prone field mapping, and limited visibility into reconciliation and data flow.
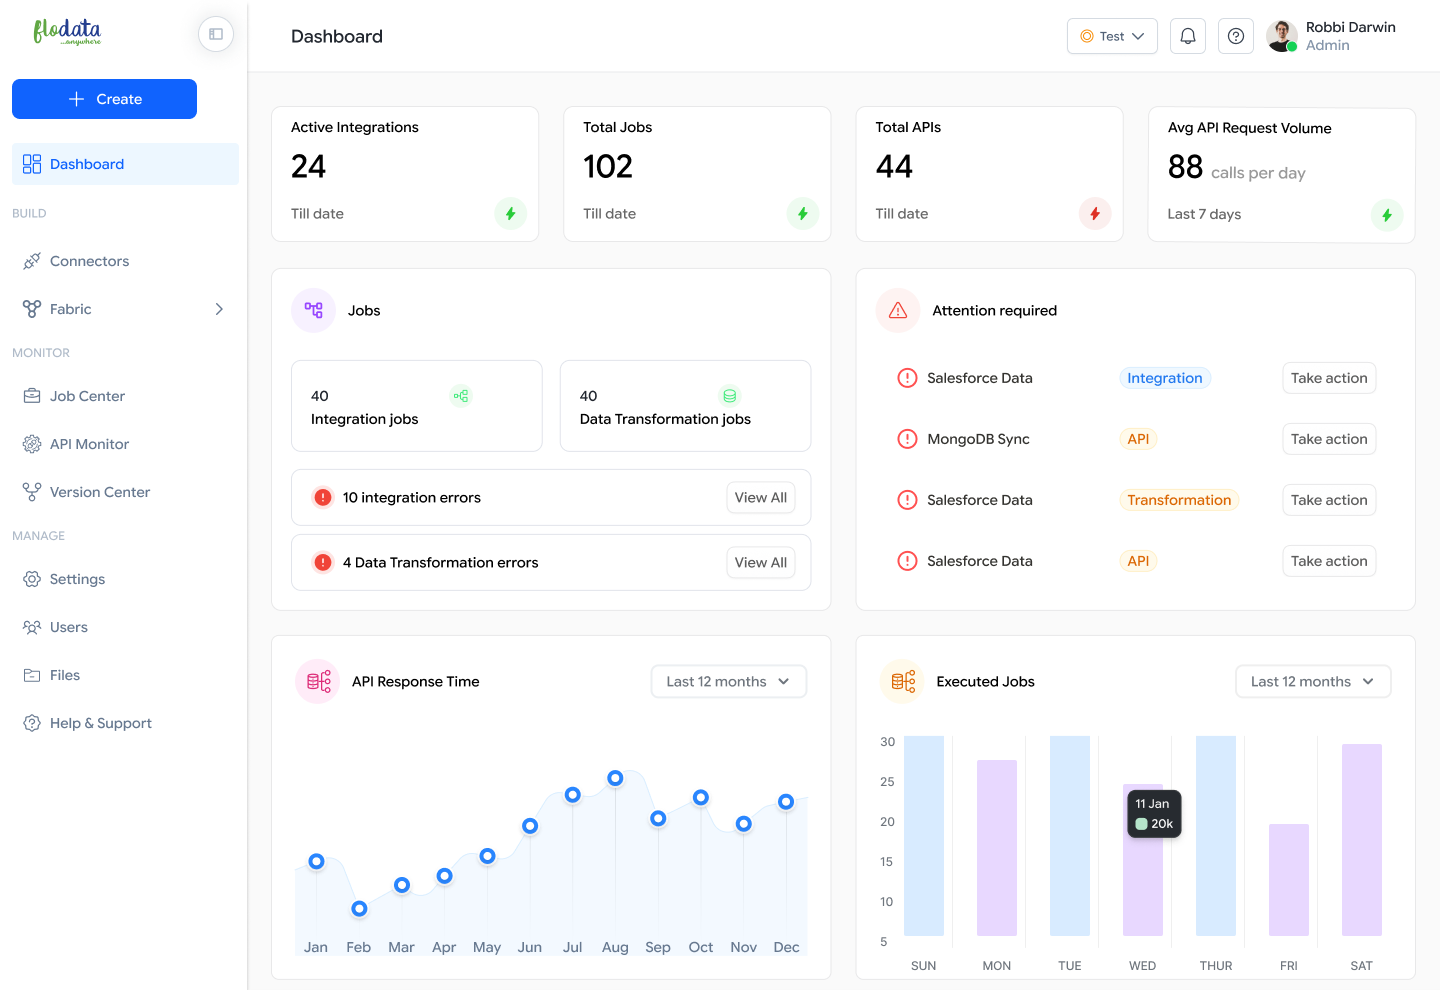
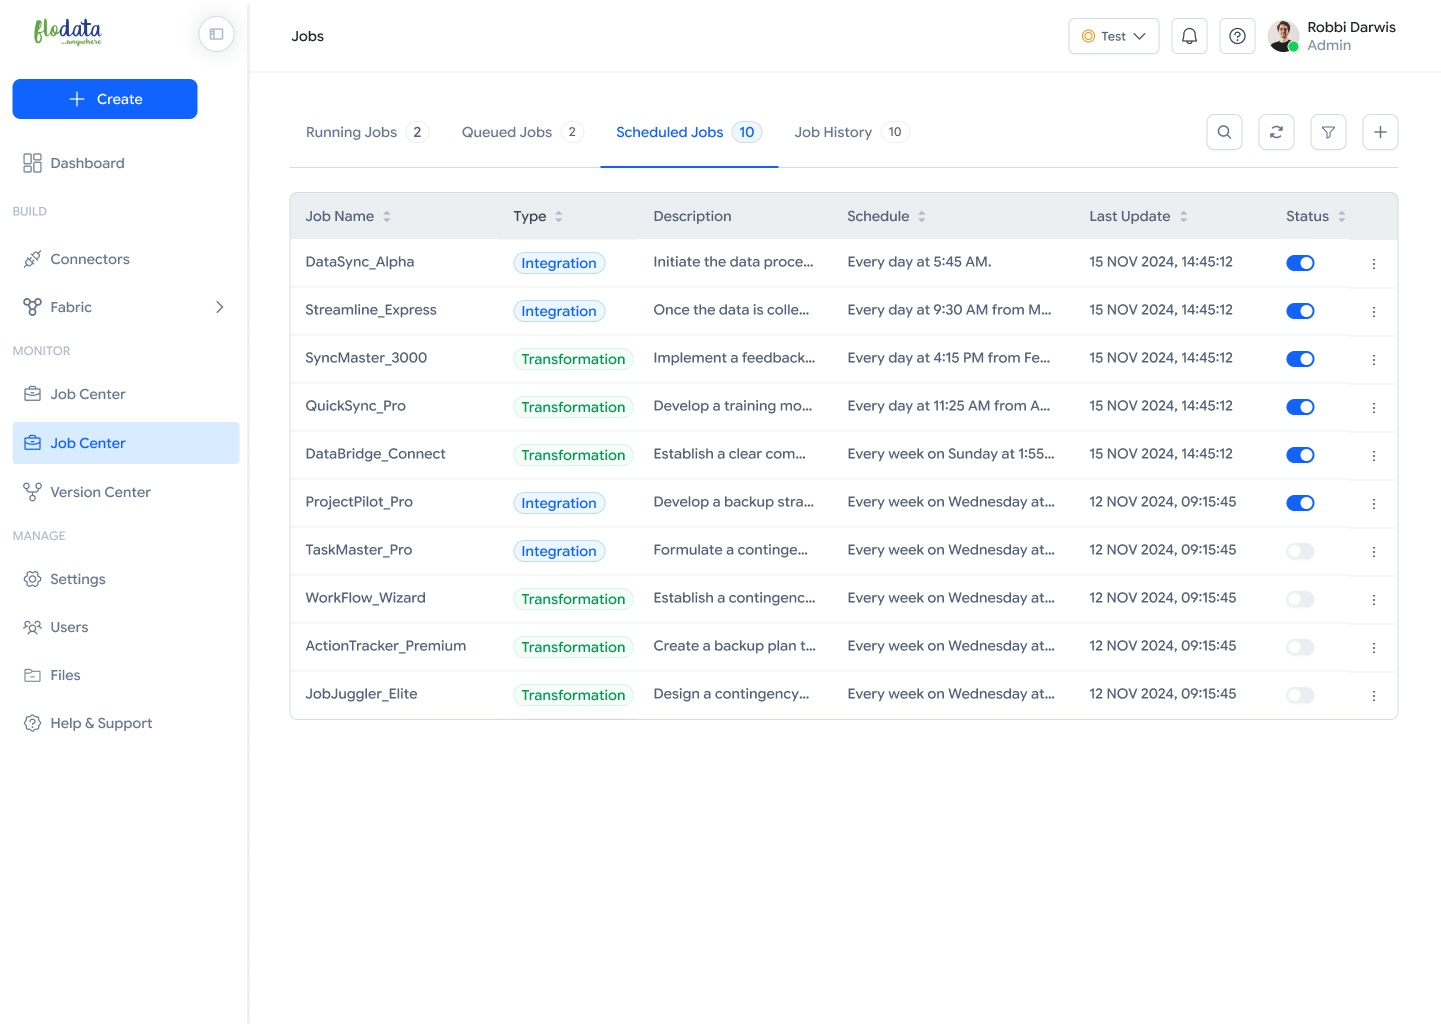
Dashboard
The Flodata Dashboard gives users a 360° view of integrations, jobs, and system health at a glance. It’s designed for both business visibility and technical control, so teams can monitor operations in real-time and take quick actions when needed.
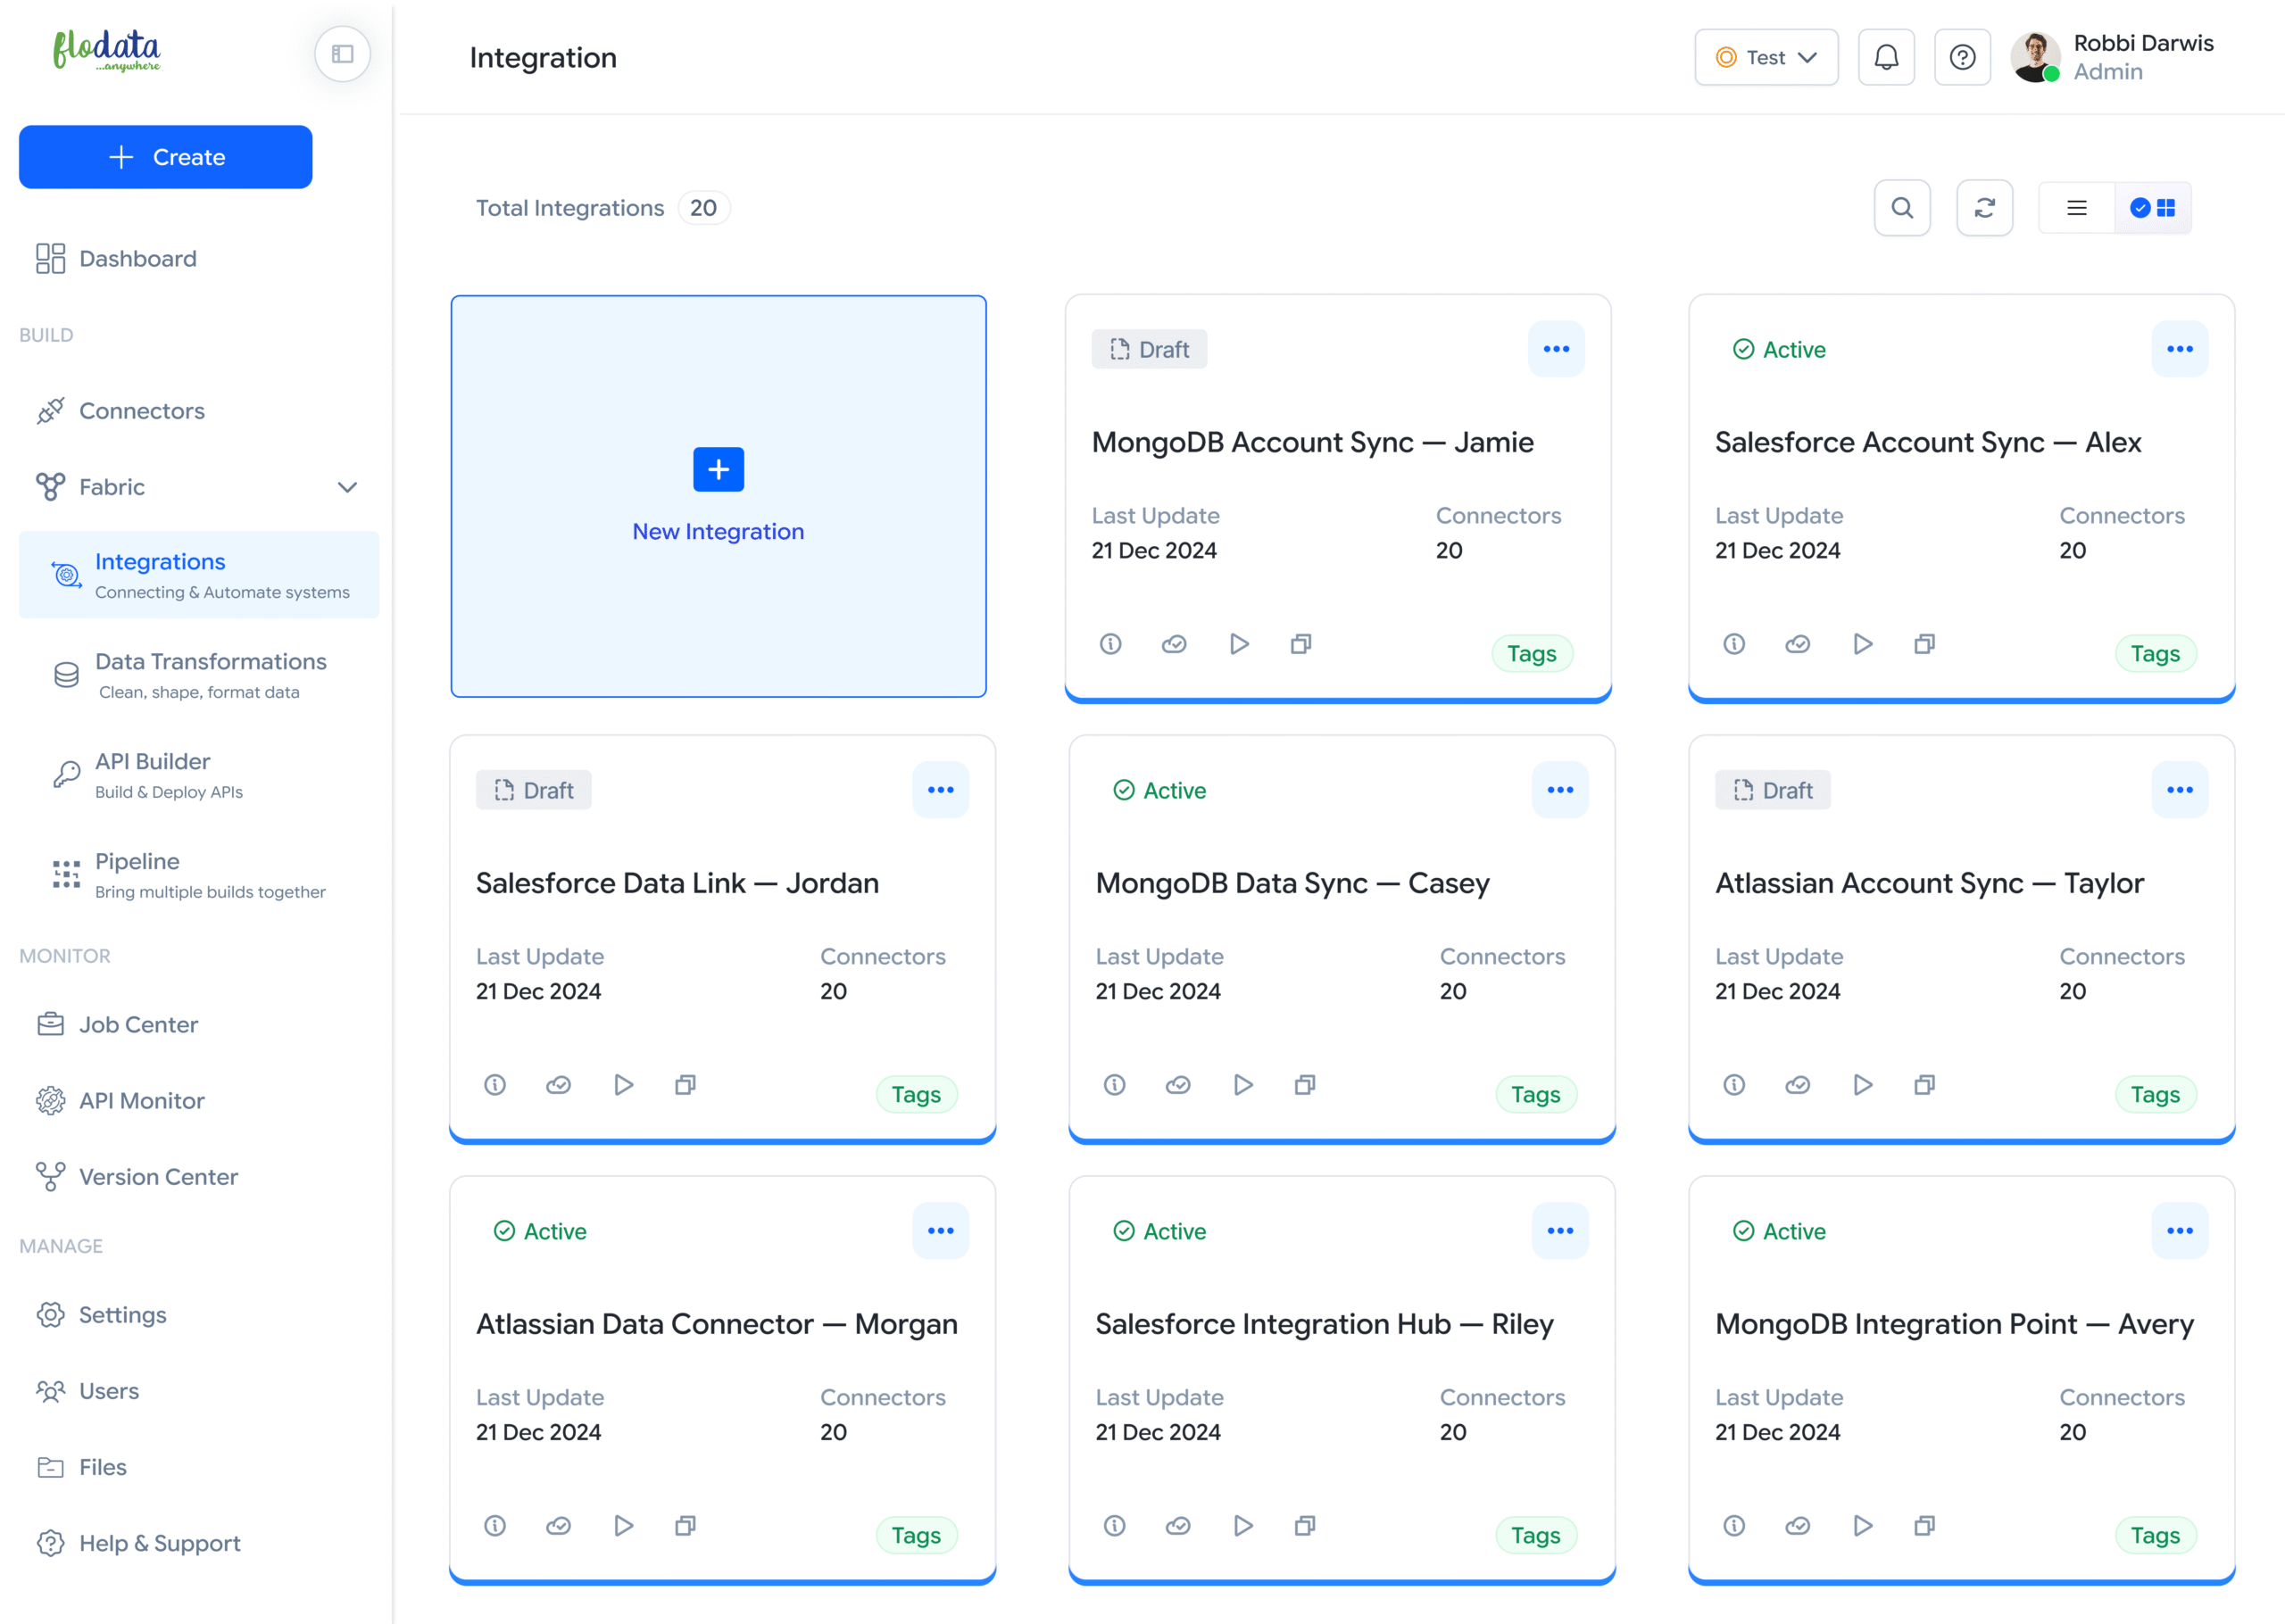
Integrations
The Integrations page is where users create, manage, and monitor all system connections in one place. It provides visibility into every integration’s status, last update, and configuration details—ensuring smooth automation across systems.
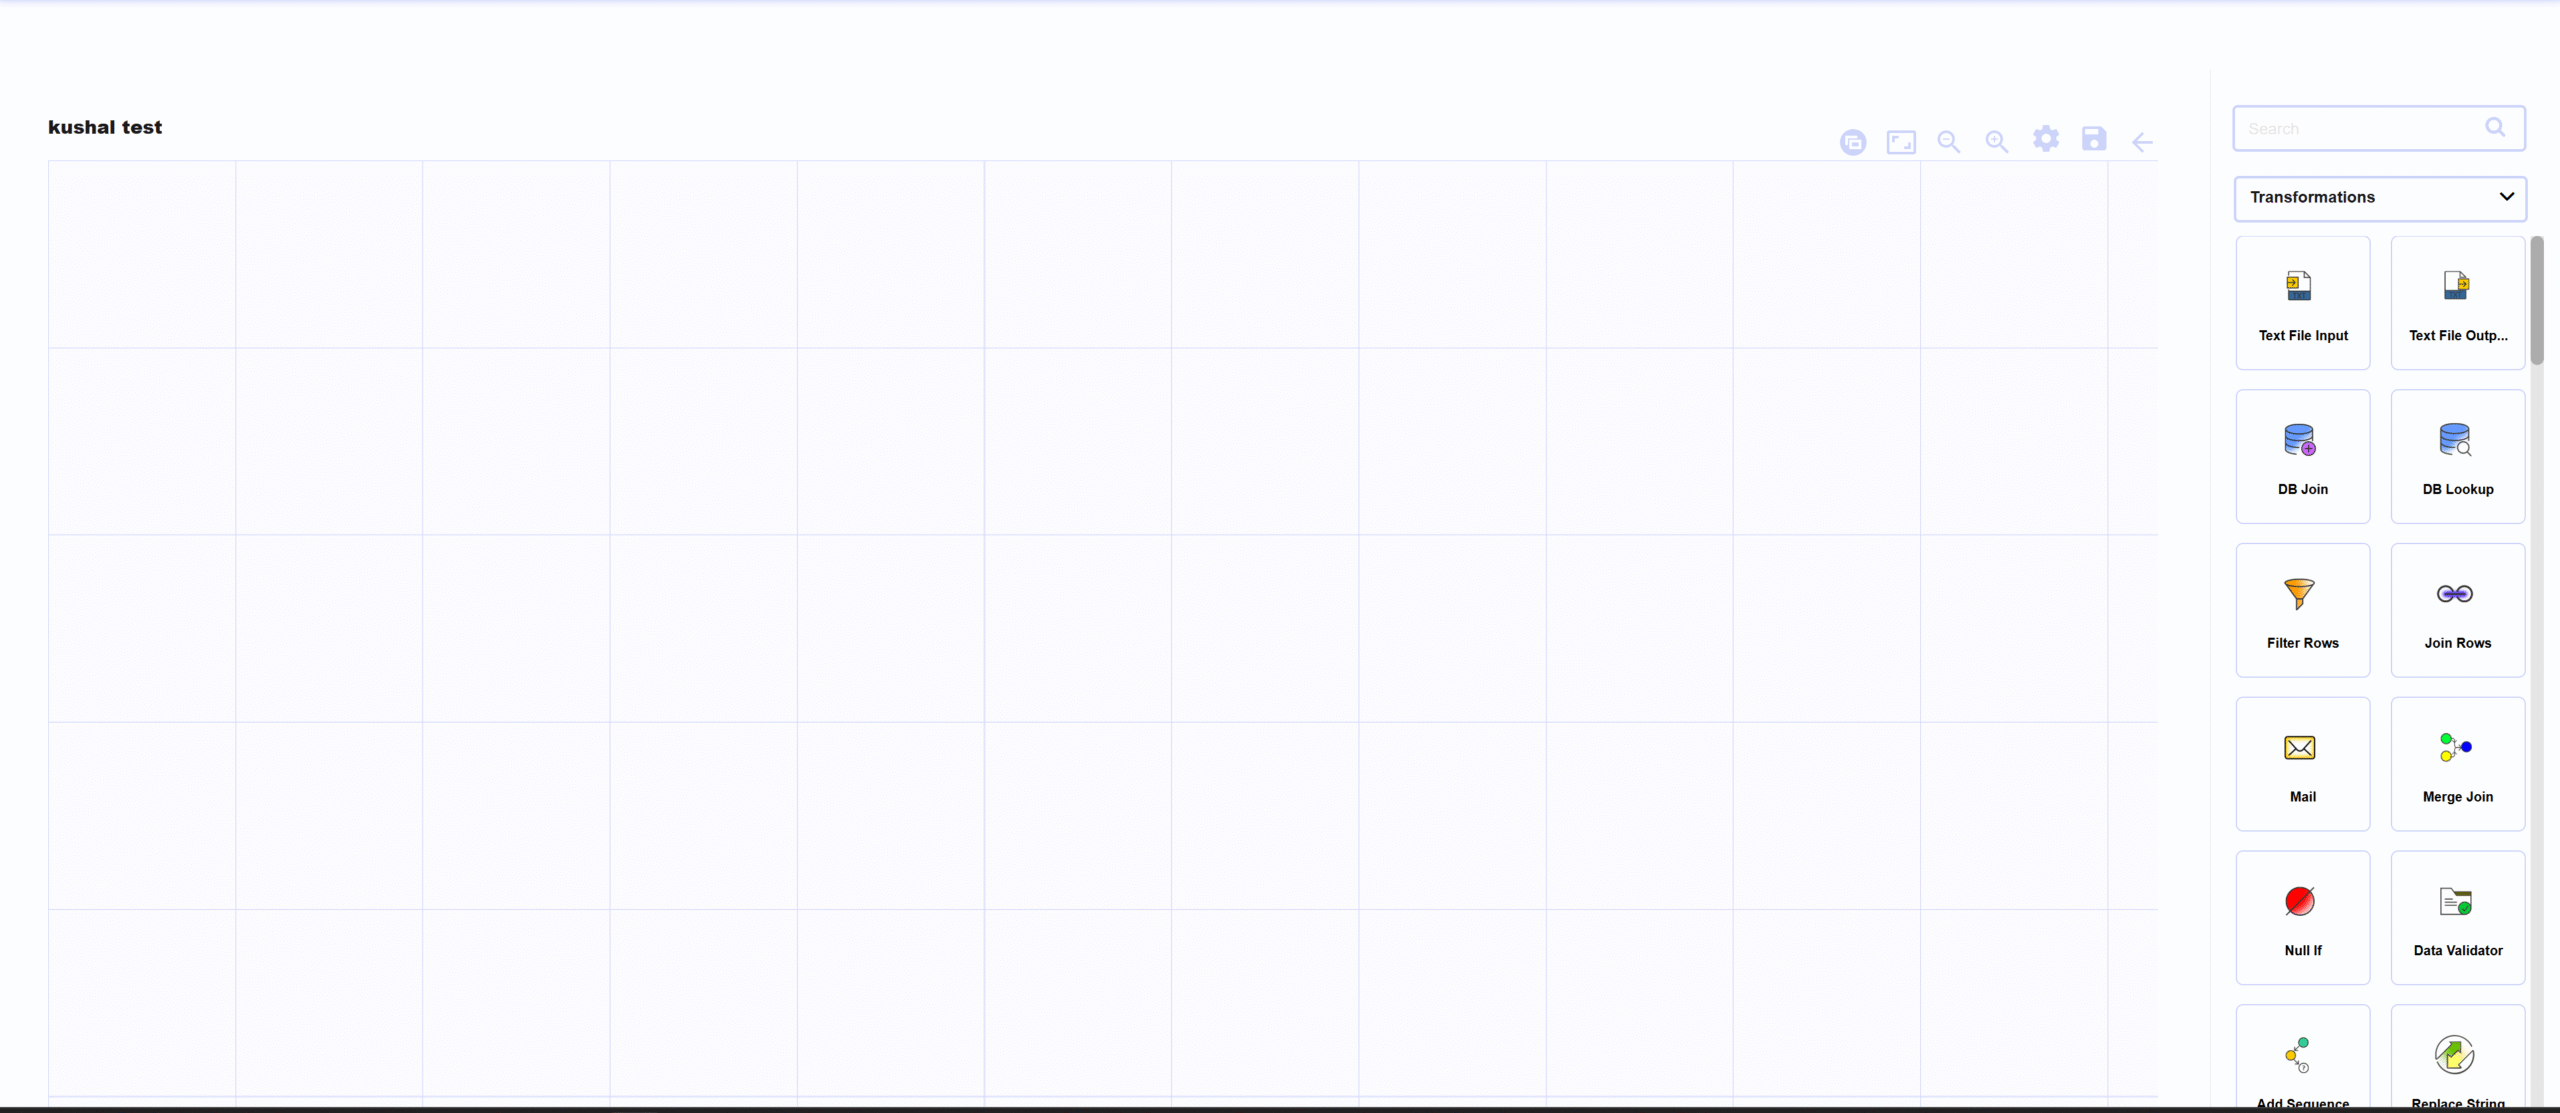
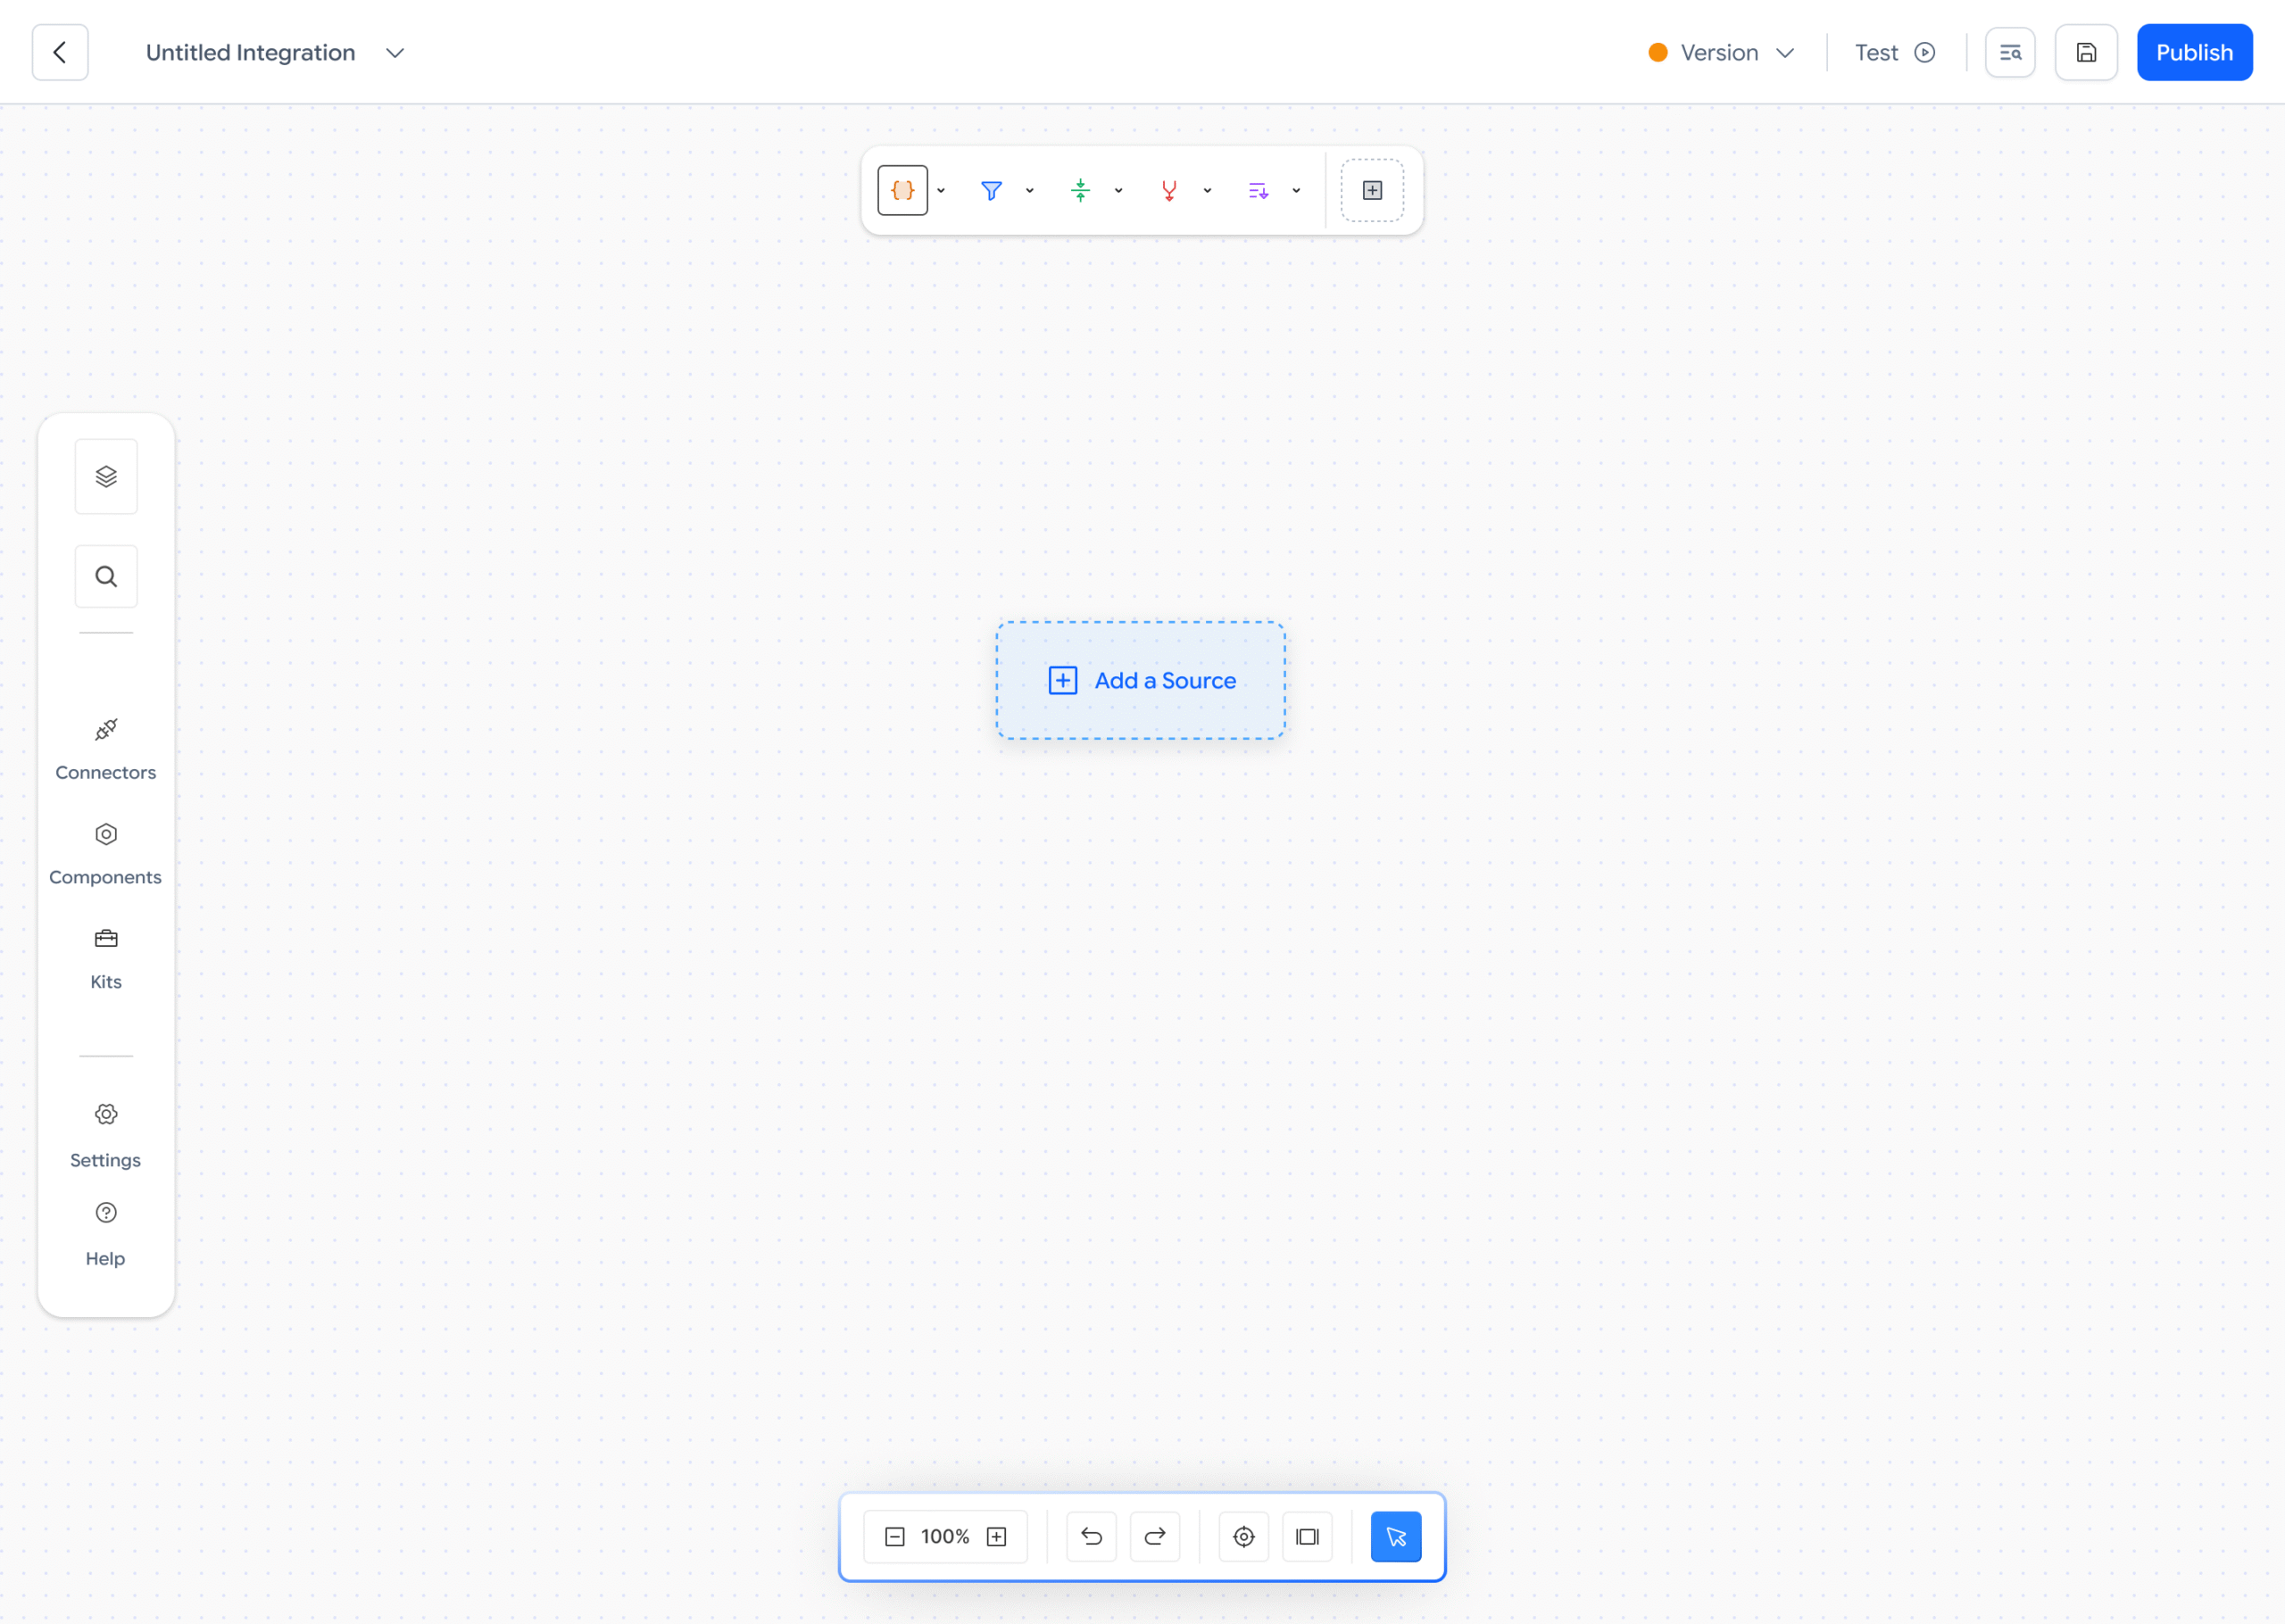
Designer
Legacy Flow to Unified Flow
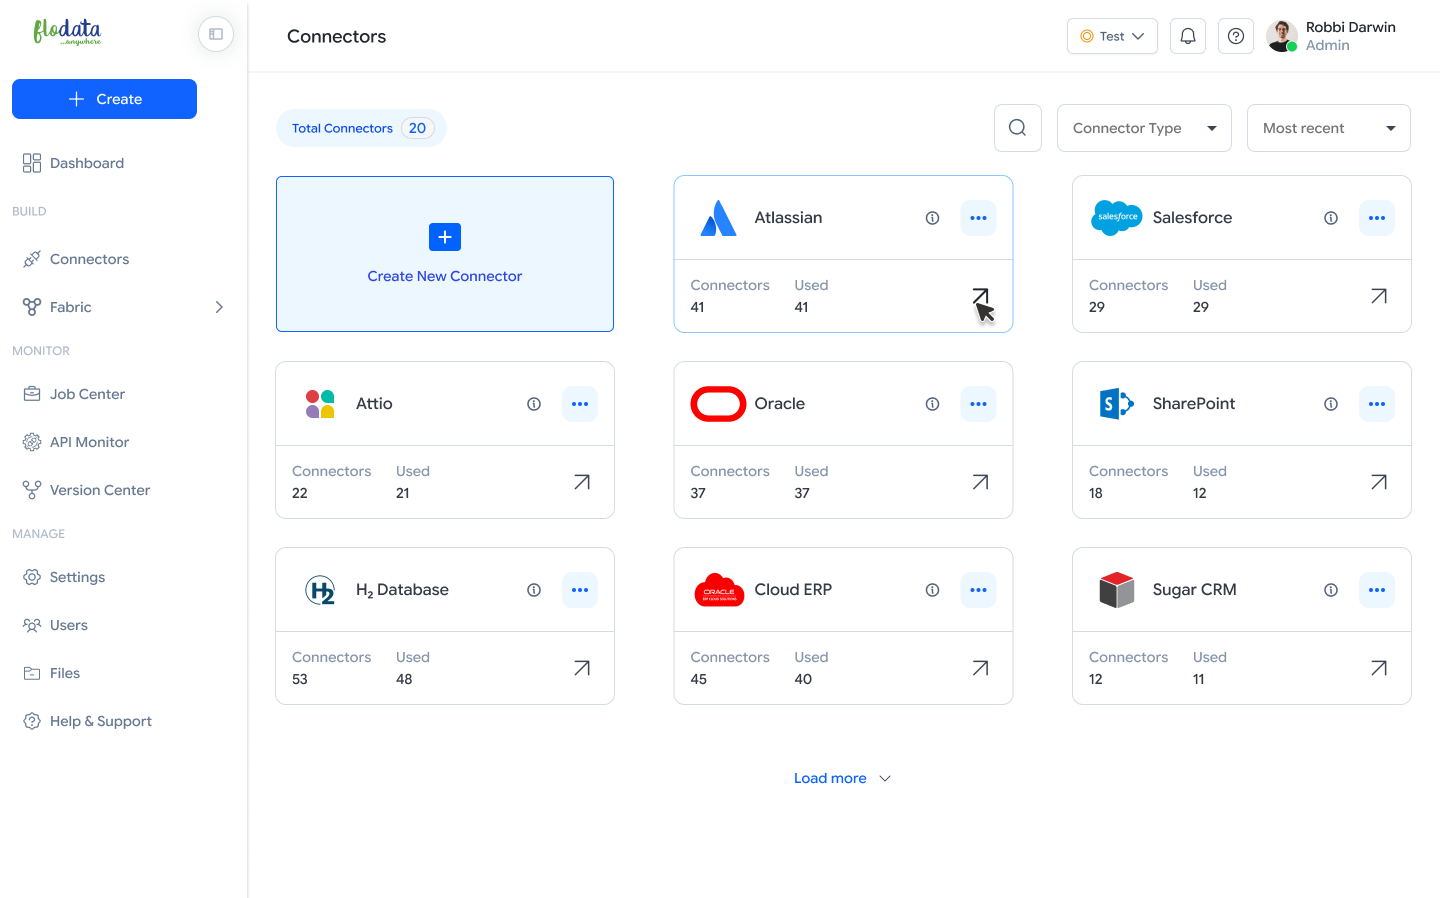
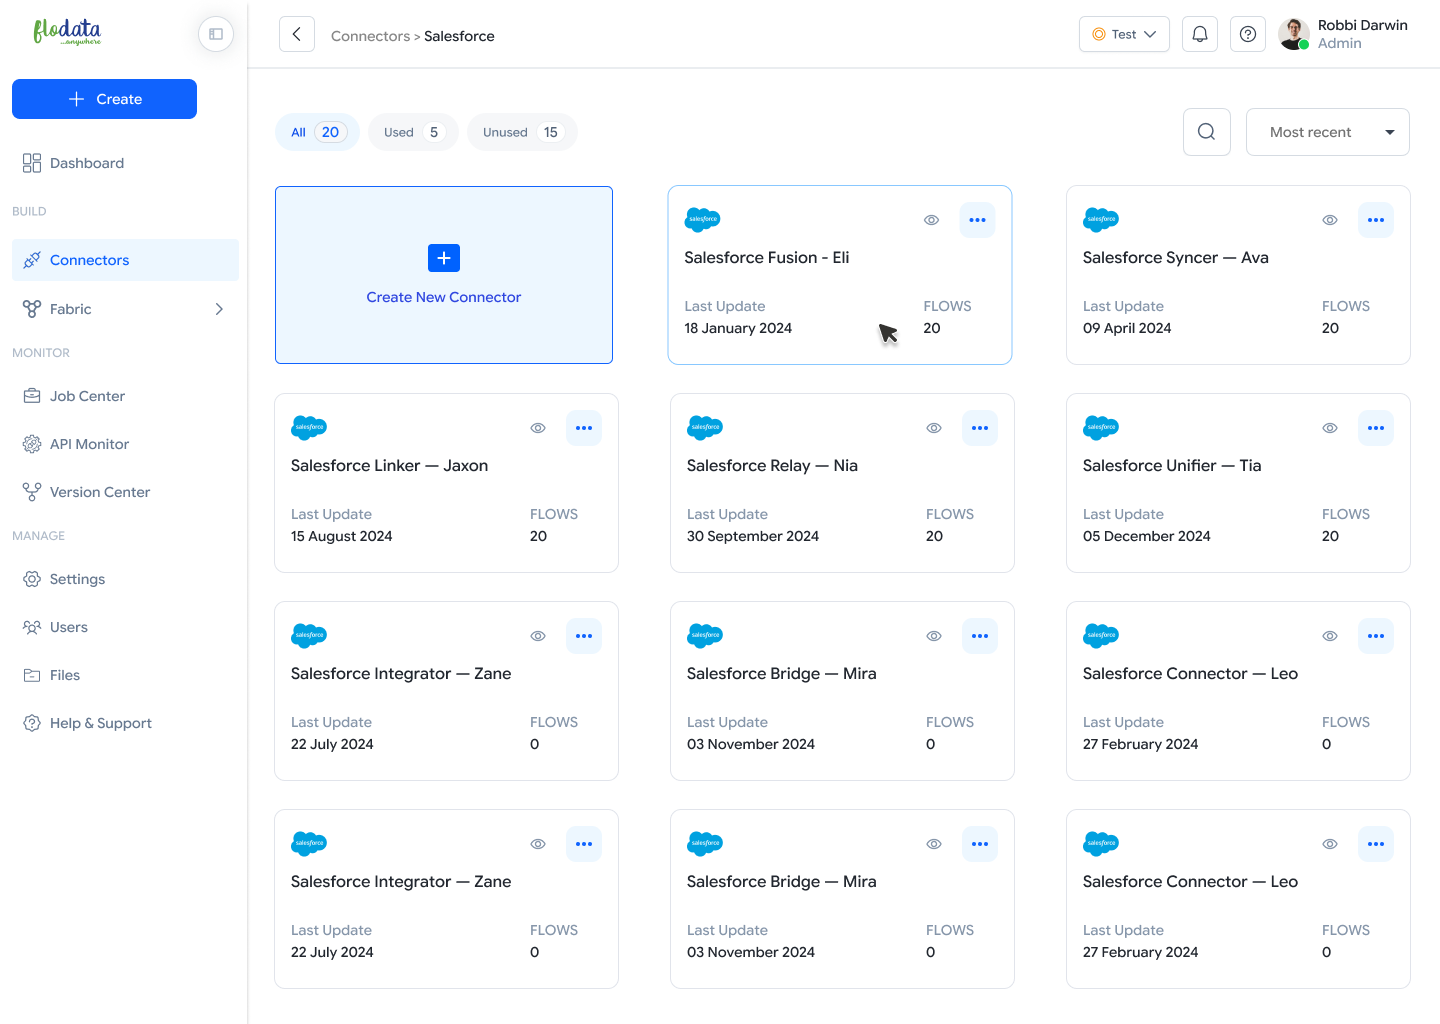
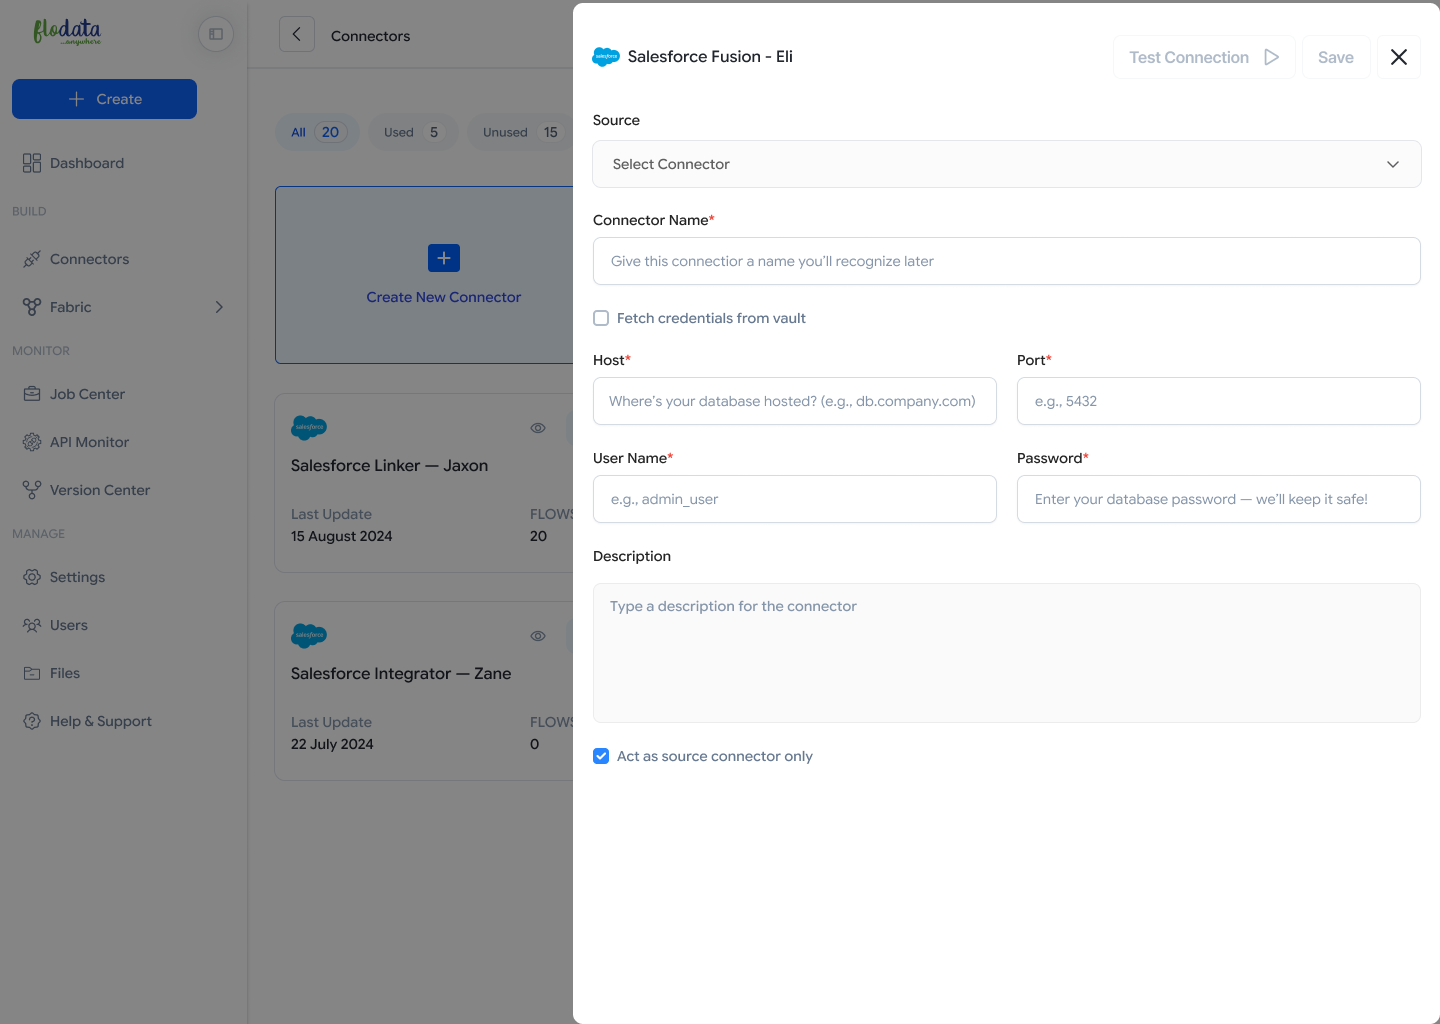
Connectors
The Connectors page is where users manage all system connections (databases, CRMs, ERPs, apps, and services) that power their integrations. It provides a catalog of available connectors with usage stats, making it simple to add new ones or monitor existing connections.